
This article was created with the AI assistant Claude and published by Peter Hoenig.
“We guarantee you 99.9 per cent availability.” The sentence appears in many contracts and sounds reassuring. Calculated round the clock it is almost nine hours of downtime a year – a whole working day. That is the first figure missing from most SLA conversations.
The second one matters even more: what comes out when several such promises work together?
The table worth knowing by heart
Based on round the clock (8,760 hours a year), downtime per year and per month:
- 99 % – 3 days 15 hours a year, 7 hours 18 minutes a month
- 99.5 % – 1 day 19 hours a year, 3 hours 39 minutes a month
- 99.9 % – 8 hours 45 minutes a year, 43 minutes a month
- 99.99 % – 52 minutes a year, 4 minutes a month
- 99.999 % – 5 minutes a year, 26 seconds a month
Two more decimal places cost roughly a factor of ten each time. So the question in a negotiation is not “how many nines do we get?” but: how much downtime is bearable – and when?
Because a percentage says nothing about when the downtime falls. Two hours at month end weigh more heavily in accounts than two hours on a July night. The tool cannot calculate that; but it can raise the question, and in a contract conversation that already counts for a lot.
The real point: chains
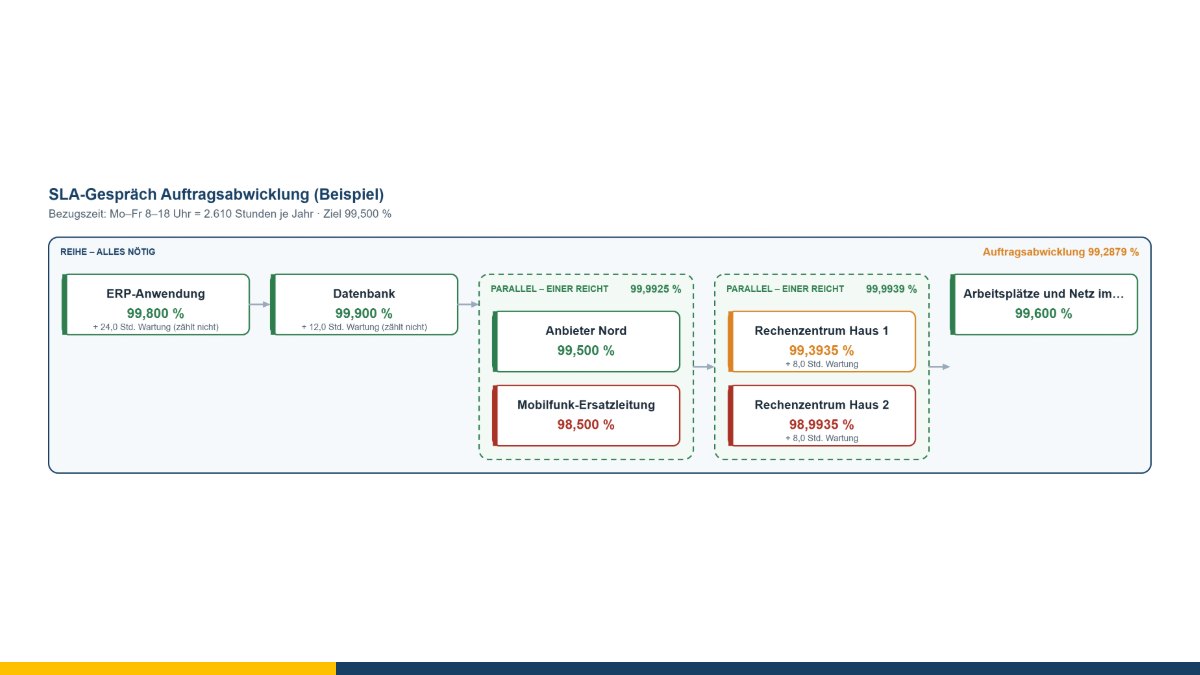
This is where it gets practically important. Three systems at 99.9 per cent each in series do not make 99.9 per cent but 99.7 – the figures are multiplied. Just under 9 hours becomes about 26 hours of downtime a year. Every additional dependency makes the chain worse, even if every single contract looks good.
The other way round in a parallel group: two paths at 99 per cent each make 99.99 per cent, because both would have to fail at once. That is why redundancy buys so much – and why it only buys that much if the paths really are independent. Two lines in the same cable duct are not two paths.
In the tool you build this as nested boxes: a series containing a parallel group containing two elements. The result appears on every group, and at the very top stands what the users get.
Maintenance – the figure people argue about
In many contracts planned maintenance does not count as downtime. That is a common and defensible arrangement, but it shifts the figure considerably: 24 hours of maintenance a year is more than three times what 99.9 per cent allows in unplanned downtime.
So every element has two entries: maintenance hours per year and a tick box “does not count as downtime”. Without the tick the tool subtracts the maintenance – so you can see what actually reaches the users, regardless of what the contract calls it. The two figures side by side make a good conversation piece.
Where is the lever?
On the right the tool works through every element and calculates how much downtime would disappear if it never failed, then ranks them. That reorders the discussion surprisingly often: the lever is rarely the most expensive system but the one that stands alone in the chain with no standby path.
Honest about the limits
The calculation assumes that the elements fail independently. In reality a power cut, a network fault or a faulty update often takes several down at once; the true figure then lies below this one. And the tool calculates with the numbers you enter – which come from contracts, not from measurements.
It is therefore good for comparing designs and as a basis for a conversation about service levels. It is not a promise, and it does not replace measuring actual operations.
You do not have to type the chains in, by the way: the outage simulation and the service tree can hand over the dependencies of a process or a service; the elements then arrive preset to 99.9 per cent and you fill in the real figures.
The availability calculator is free of charge and available as free software under the GPL: open the availability calculator. If a service level negotiation is coming up, I am happy to look at the chain with you – get in touch for a free initial consultation.
Open or download the tools
- Outage simulation (what fails if this one fails?)Open Download (445 KB)
- Service catalogue as a treeOpen Download (434 KB)
- Availability and SLA (per cent, downtime, chains)Open Download (439 KB)
Thinking further
You can find more on this topic under IT service management consulting – or talk to me directly in a free initial consultation.
Comments
Comments are published immediately with your name. Only the name, title, comment text and time are stored – see the privacy policy.
Loading comments …